The $6.75M Revenue Risk Hidden in Duray’s Homepage
16 min readOgbonna Patrick Ebuka
A Revenue Health Scan of a $15M–$25M Ecommerce Brand
Executive Summary
Duray Products is a Canadian manufacturing and ecommerce brand operating in the $15M–$25M annual revenue range, known for producing high-quality wool socks and outdoor apparel. Despite strong brand equity and consistent product demand, the company’s digital storefront is underperforming in converting existing traffic into measurable revenue outcomes.
This revenue growth audit and homepage health scan was conducted to identify hidden friction points within the above-the-fold experience and quantify their impact on ecommerce performance. The focus was not on traffic acquisition, but on revenue efficiency — how effectively existing visitors are converted into engaged shoppers and customers.
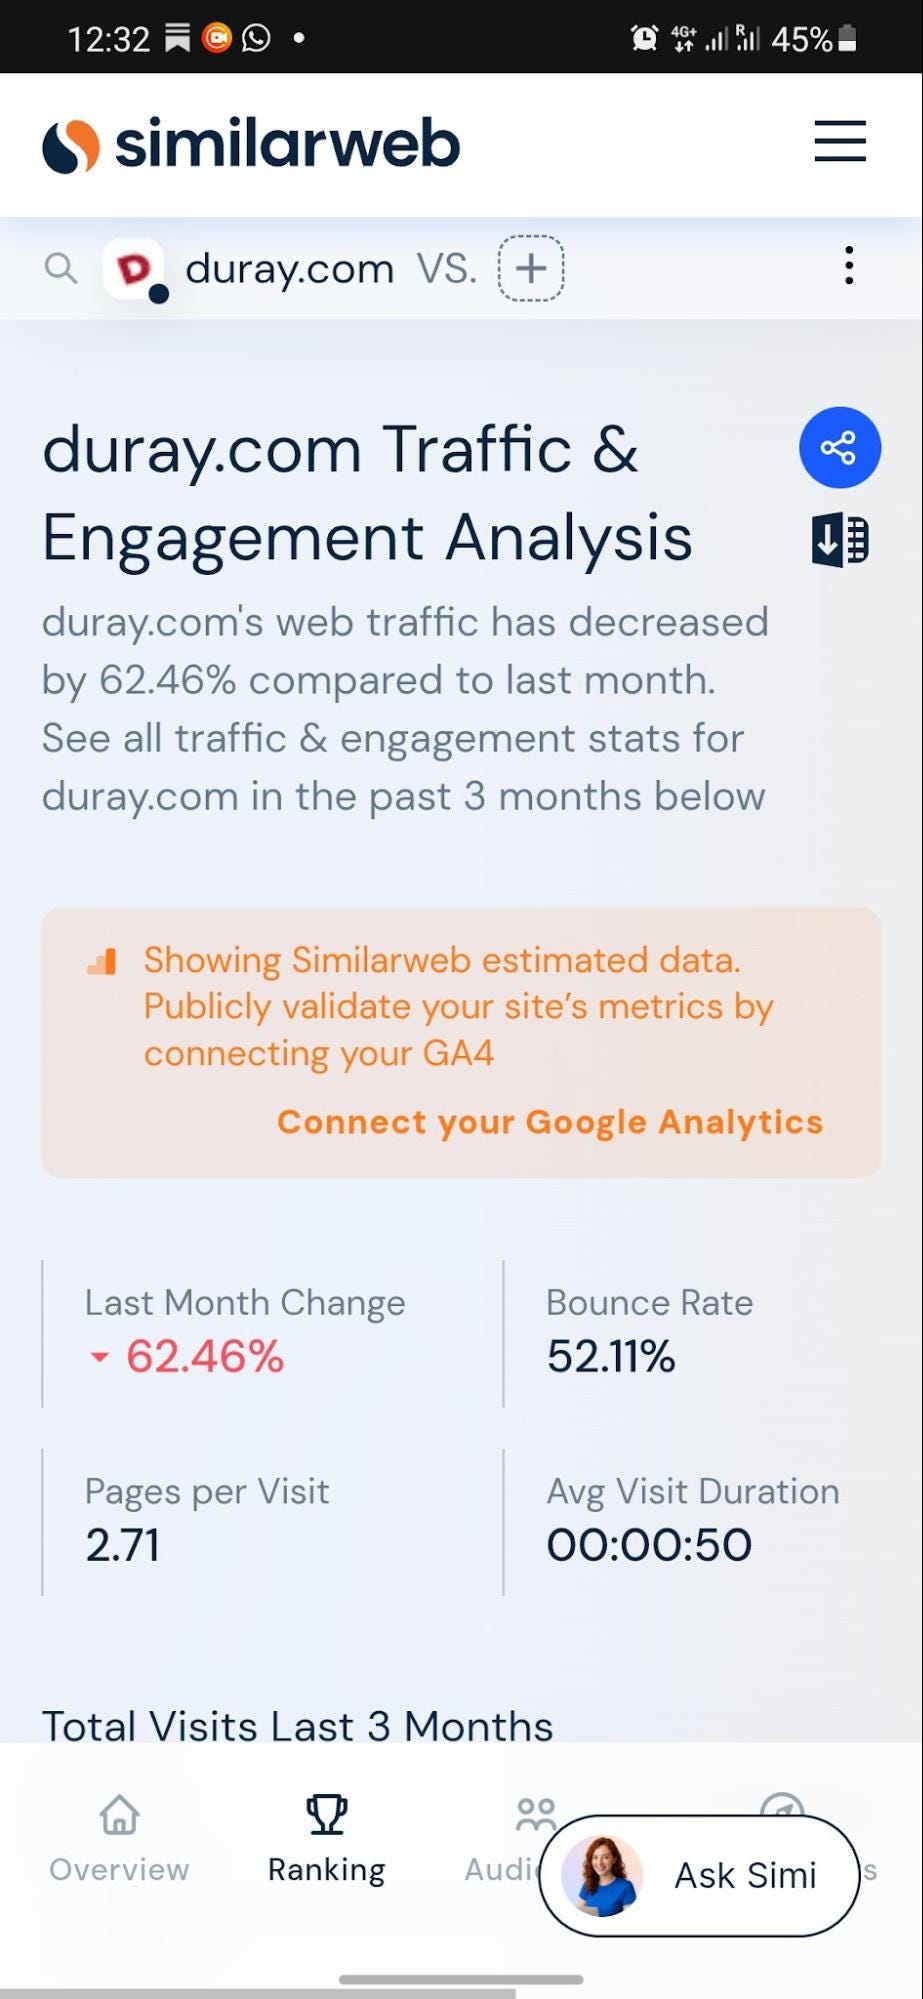
The findings reveal a significant conversion gap driven by three core issues: unclear messaging, low-visibility conversion elements, and missing tracking infrastructure. These are contributing to a 52.11% bounce rate and a 62.46% decline in traffic performance indicators, suggesting that a large share of high-intent visitors are exiting without meaningful engagement.
Most critically, the homepage is not effectively guiding users from attention to purchase intent. The primary CTA lacks visual prominence, the headline communicates product identity rather than customer value, and there is no system in place to recover or retarget lost visitors.
Based on observed friction and CRO benchmarks, the current homepage is estimated to be suppressing conversion potential by approximately 45%, representing a potential revenue opportunity of up to $6.75M annually if addressed systematically.
This report outlines the key revenue leaks, their underlying causes, and a structured Revenue Growth System to recover lost conversions and unlock existing traffic potential.
Company Background
Duray is a Canadian manufacturing brand specializing in premium wool socks and outdoor apparel designed for durability, comfort, and performance in demanding conditions. Built on a long-standing reputation for quality craftsmanship and material integrity, the brand serves both everyday consumers and customers operating in harsh environments.
The company operates a multi-channel business model that combines direct-to-consumer ecommerce, wholesale distribution, and retail partnerships. This structure allows Duray to reach customers through its own digital storefront, third-party retail environments, and established distribution networks across Canada and international markets.
Within this model, the ecommerce channel plays a critical role as both a revenue driver and brand experience hub. It is the primary space where product value is communicated, customer perception is shaped, and purchase decisions are made without intermediary influence, making its performance essential to overall revenue efficiency and growth.
The Challenge
Symptoms
The audit of Duray’s ecommerce experience revealed a set of interconnected performance issues that collectively indicate a breakdown in the homepage’s ability to convert attention into engagement and revenue.
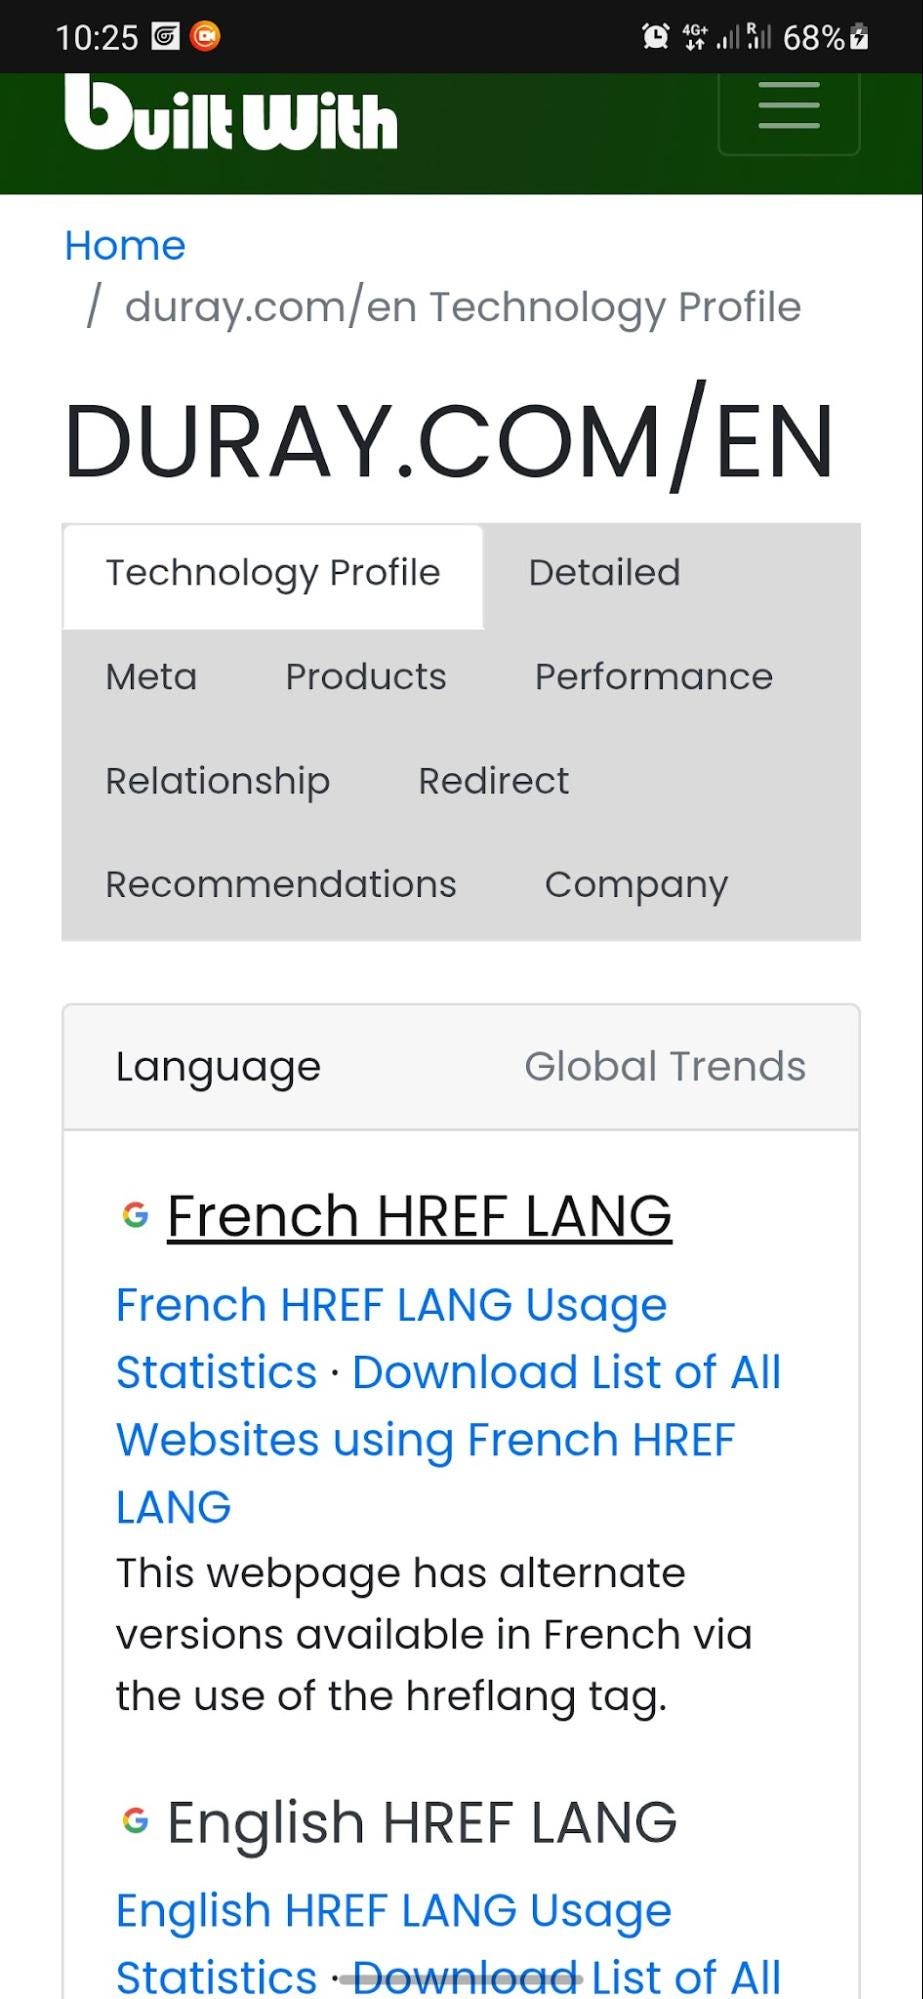
A key signal was a 62.46% decline in organic traffic performance, suggesting not only challenges in acquisition efficiency but also an inability to retain value from existing traffic sources. In parallel, a bounce rate exceeding 52% shows that more than half of visitors exit the site without progressing beyond the initial landing experience.
Beyond these metrics, the above-the-fold experience shows clear weaknesses in guiding user attention and establishing a compelling value proposition. Visitors are not immediately oriented toward a clear next step or structured journey, resulting in weak early-stage engagement signals.
Messaging further contributes to this friction. The homepage relies heavily on product identification rather than outcome-driven communication, requiring users to interpret value on their own instead of being guided toward benefits or use cases. In addition, a critical infrastructure gap exists in the form of missing tracking and analytics systems, limiting visibility into user behavior beyond the initial visit.
Business Impact
These symptoms translate into a measurable revenue inefficiency across the acquisition funnel. With more than half of visitors exiting before reaching product pages, the customer journey is being disrupted at its earliest stage, effectively wasting a significant portion of acquired traffic.
This leads to lower return on marketing investment, not due to poor traffic quality, but because of weak on-site conversion efficiency. Existing demand is being under-monetized, with users failing to progress from interest to intent.
Compounding this issue is the absence of retargeting infrastructure. Once users leave the site, they cannot be re-engaged through paid media or lifecycle campaigns, eliminating the possibility of recovering high-intent visitors.
As a result, potential customers enter the ecosystem but exit before value is communicated, creating a structurally inefficient growth system with continuous leakage across the funnel.
Discovery & Revenue Risk Audit Findings
Audit Framework
The website was evaluated using the Revenue Growth System framework, a structured diagnostic model designed to assess how effectively a digital storefront moves users through the full revenue lifecycle — from first contact to conversion and beyond.
This framework breaks the user journey into four critical stages, each representing a potential point of friction where revenue can either be captured or lost.
**Stage 1: Attention **This stage evaluates whether visitors can immediately understand what the brand offers and why it matters. It focuses on clarity of value proposition, visual hierarchy, and the strength of the above-the-fold messaging in communicating relevance within the first few seconds of arrival.
**Stage 2: Engagement **This stage examines how effectively the experience guides users toward interaction. It assesses whether visitors can quickly identify the next logical action, such as exploring products, learning more, or initiating a purchase journey, without cognitive friction or ambiguity.
**Stage 3: Conversion **This stage evaluates the strength of the pathway from interest to purchase. It looks at whether users are clearly directed toward buying actions, how persuasive the call-to-action elements are, and whether the overall structure supports decision-making rather than delaying it.
**Stage 4: Recovery **This final stage assesses the system’s ability to retain and re-engage users who do not convert on their first visit. It focuses on tracking infrastructure, retargeting capability, and the ability to build audiences for follow-up marketing and conversion recovery campaigns.
Together, these four stages provide a complete view of revenue performance leakage across the digital experience, allowing for precise identification of where users drop off and where revenue is being left unrealized.
Revenue Risk #1: The $3.3 Million Ghost Button Problem
Finding
The primary call-to-action on the homepage is implemented as a “ghost button” — a transparent, outlined button placed over a visually busy hero background. While aesthetically minimal, this design significantly reduces functional clarity in a commercial environment where visibility directly drives conversion. The button lacks sufficient contrast, making it difficult for users to immediately identify the intended next step.
Why It Matters
In ecommerce environments, users do not search for action — they respond to what is visually obvious. When the CTA blends into the background, it interrupts decision flow at the most critical point in the journey: intent-to-action conversion. This issue is amplified for mobile users, older demographics requiring higher contrast, and users browsing in bright or high-glare conditions where low-contrast elements become nearly invisible. In practice, the CTA becomes functionally present but visually absent.
Revenue Impact
This visibility issue is estimated to suppress conversion performance by approximately 22%, translating into a potential $3.3M annual revenue opportunity at current traffic and revenue scale.
Recommended Fix
Replace the ghost button with a high-contrast, solid CTA using Duray’s brand red, reinforce visual hierarchy, and ensure the CTA is the most dominant interactive element above the fold.
Revenue Risk #2: The $2.25 Million Specificity Gap
Finding
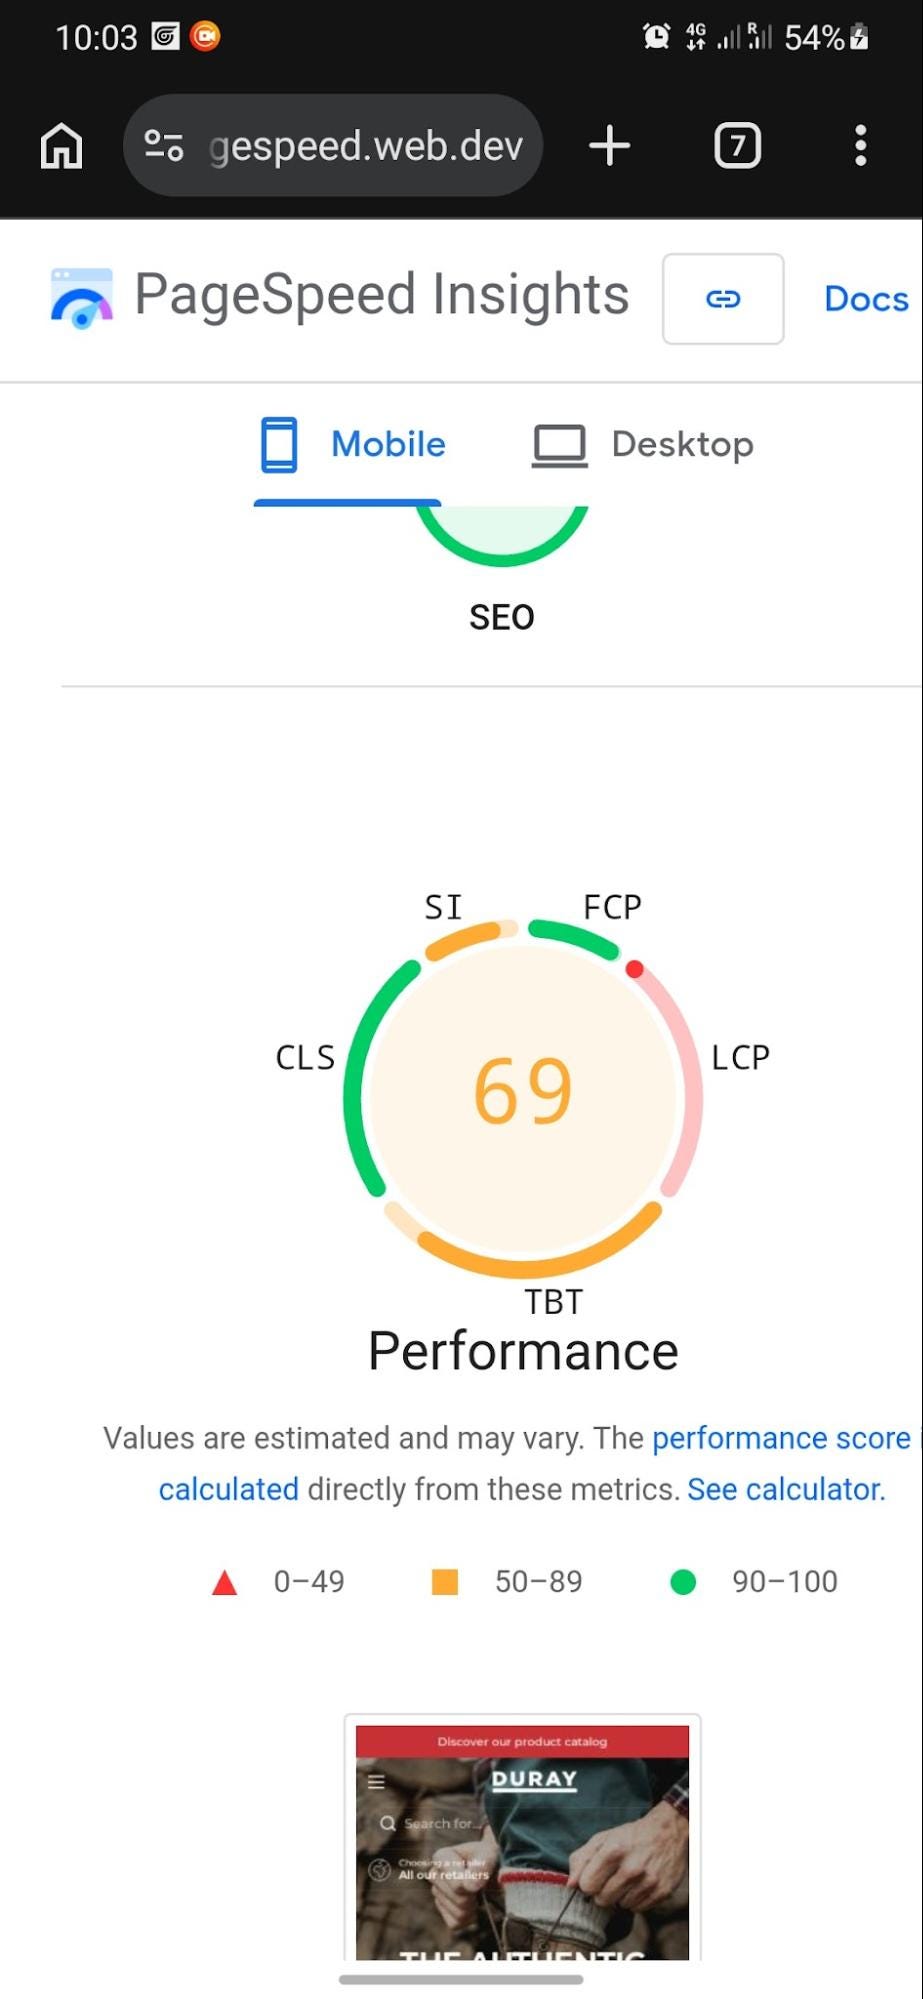
The homepage headline — “The Authentic Canadian Wool Sock” — communicates product identity but fails to express customer value. It describes what the product is, but not what the customer gets from it. As a result, it functions as a label rather than a conversion driver.
Why It Matters
Effective ecommerce messaging translates features into outcomes. The current headline creates a “specificity gap” where users must interpret value themselves. This increases cognitive load and weakens engagement. Missing from the messaging is clear articulation of benefits such as warmth, comfort, durability, and performance in extreme conditions, as well as explicit problem-solution framing and justification for premium pricing versus cheaper alternatives. Without this, users have no immediate reason to prioritize Duray over competing options.
Revenue Impact
This messaging gap is estimated to suppress conversion by approximately 15%, representing a potential $2.25M annual revenue opportunity.
Recommended Fix
Shift from feature-based to outcome-based messaging. Prioritize emotional and functional benefits over product identity. Replace descriptive copy with value-driven positioning such as: “Unbeatable Warmth for Your Toughest Days.”
Revenue Risk #3: The 52% Bounce Tax
Finding
The homepage records a 52.11% bounce rate, meaning more than half of visitors exit without meaningful engagement or reaching product pages. This reflects not traffic quality issues, but breakdowns in on-site direction and conversion flow.
Root Causes
Three core issues drive this early-stage drop-off. First, CTA language such as “Discover Our Collections” is passive and non-committal, failing to communicate clear intent. Second, the homepage lacks a defined hierarchy that visually prioritizes the primary buying action. Third, users are not guided through a structured journey, forcing them to self-navigate rather than being directed toward product discovery.
Revenue Impact
This friction results in an estimated 8% conversion suppression, equating to approximately $1.2M in lost annual revenue potential.
Recommended Fix
Replace passive language with direct, action-oriented CTAs that reflect purchase intent. Strengthen visual hierarchy so the primary action is unmistakable. For example, replace “Discover Our Collections” with “Shop Wool Socks.”
Revenue Risk#4: Missing Revenue Recovery Infrastructure
Finding
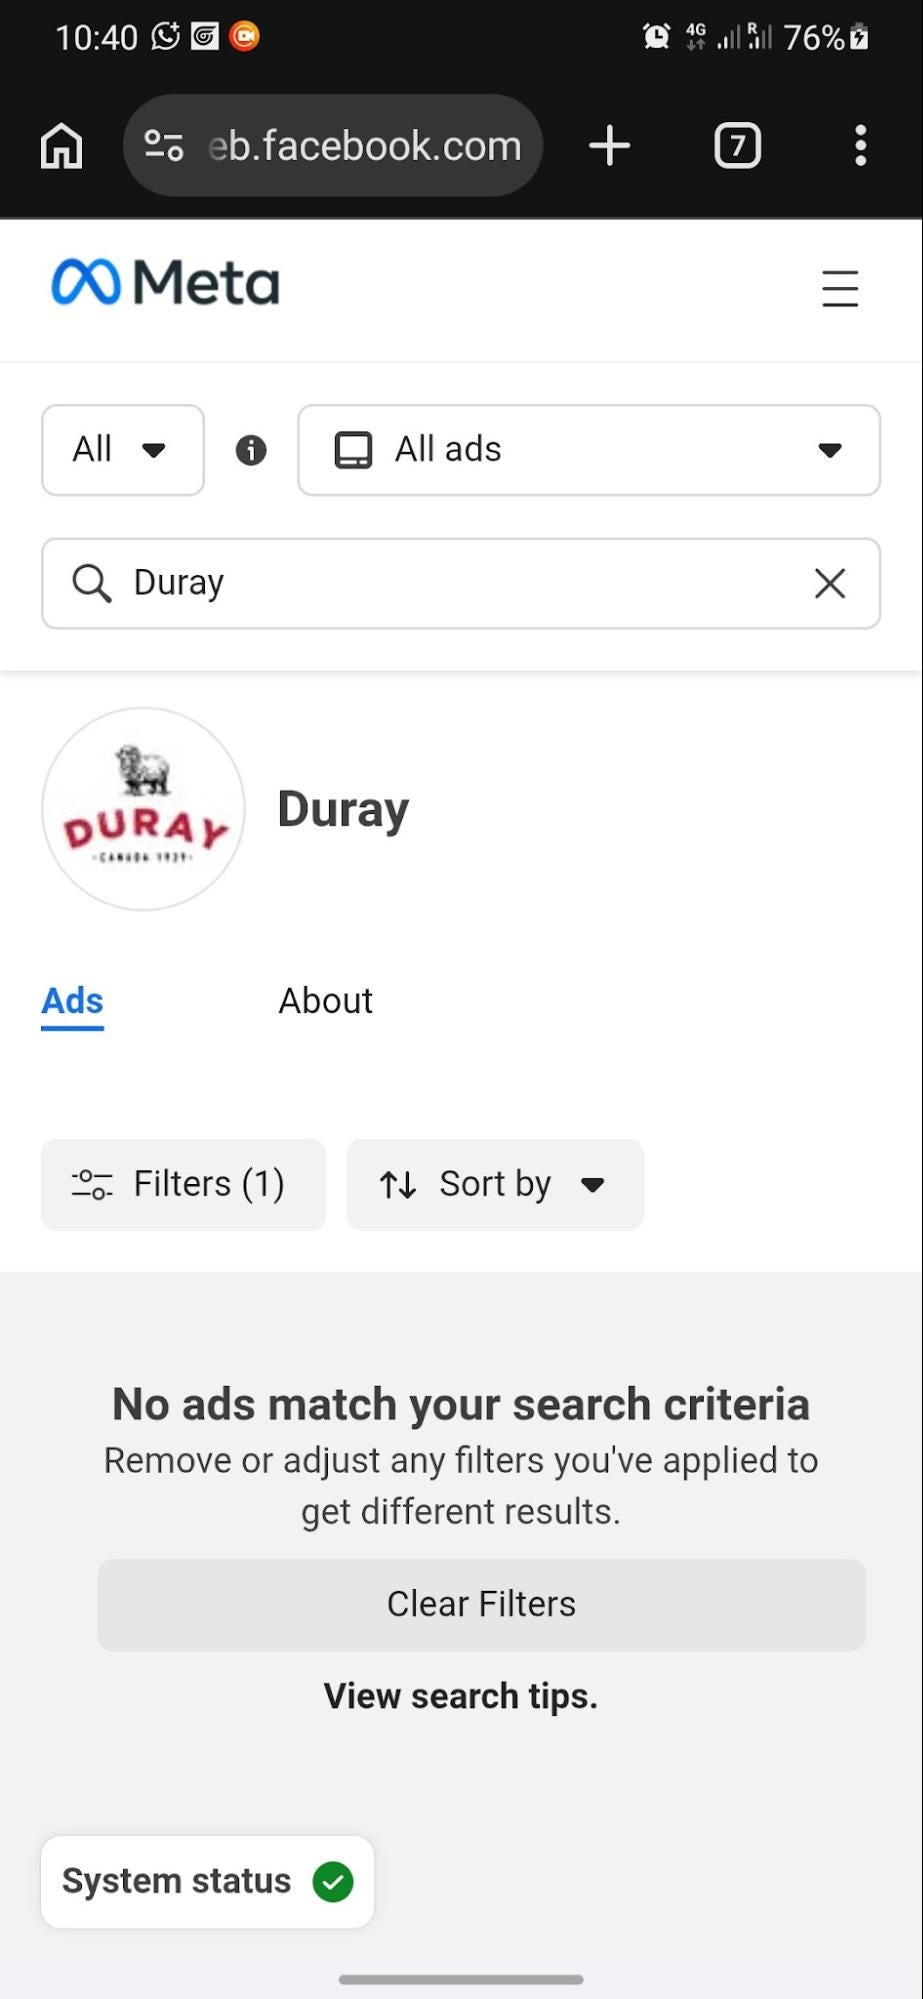
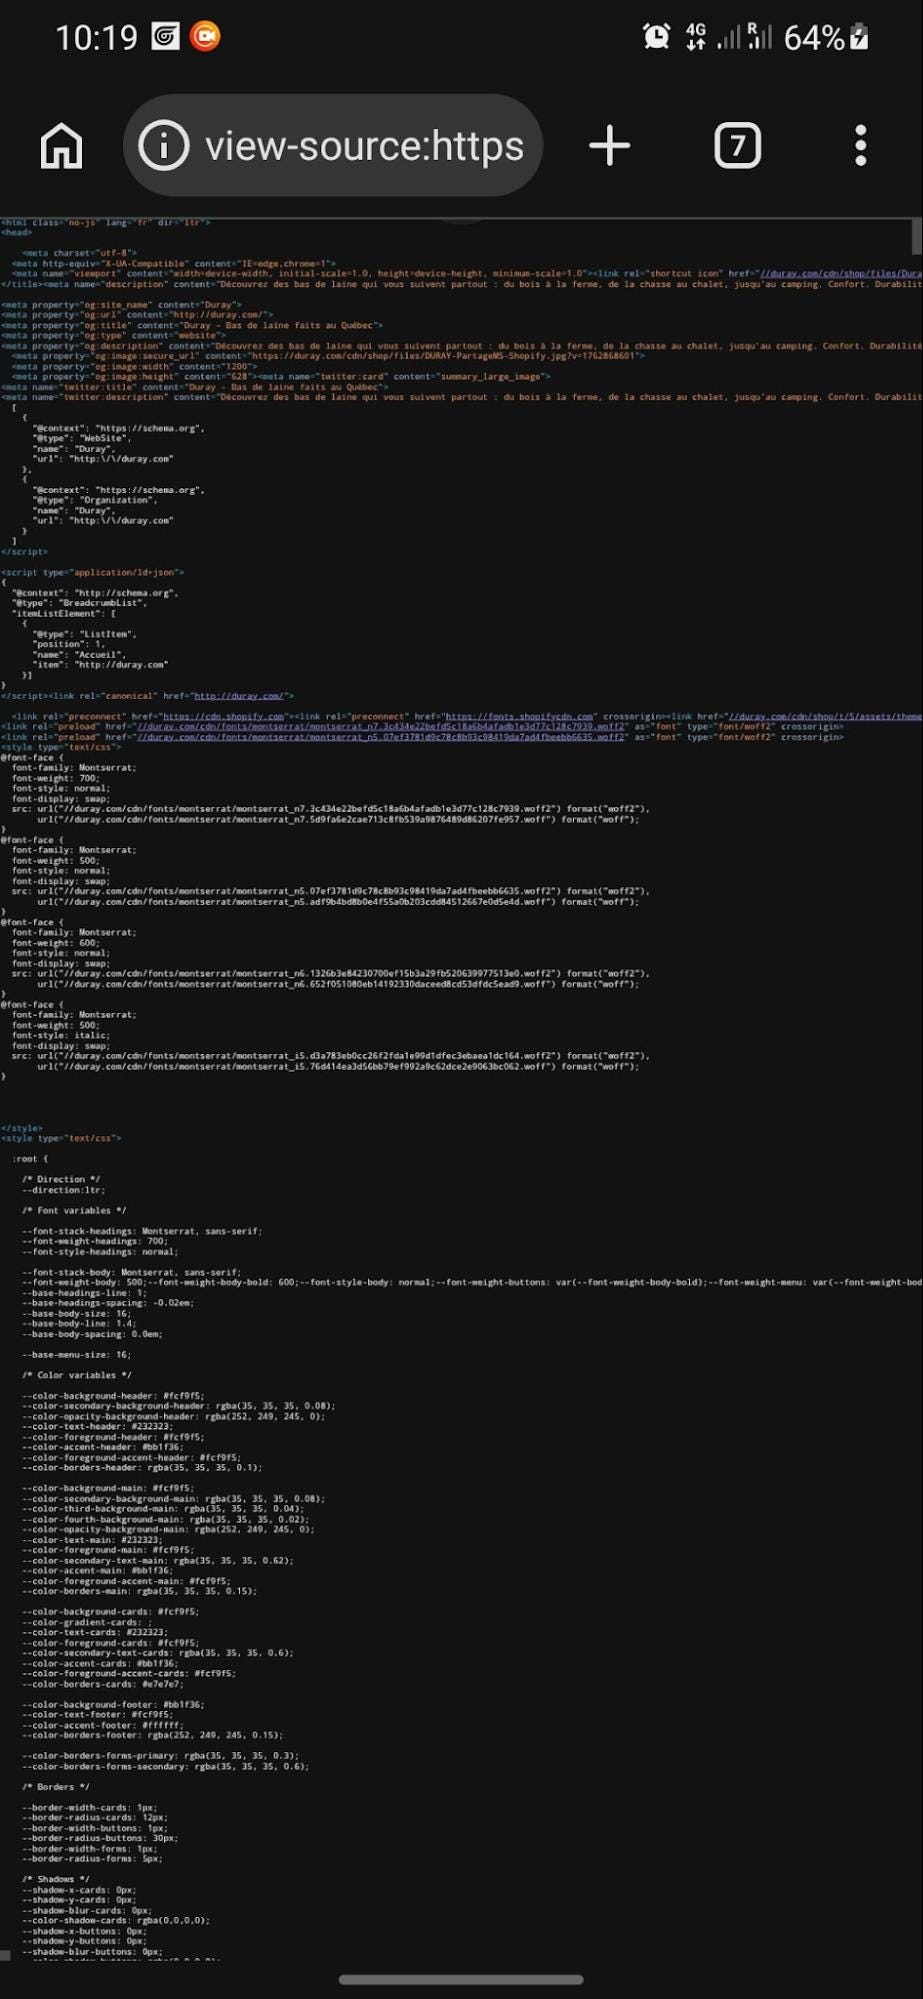
The website lacks foundational tracking and recovery systems, including Google Analytics, Meta Pixel, and structured retargeting capabilities. As a result, user behavior beyond the initial visit is not captured, analyzed, or reactivated.
Business Impact
This creates a structural revenue limitation where every non-converting visitor is permanently lost from the marketing system. Without tracking, there is no ability to build audiences, segment users by intent, or understand funnel drop-off points. Without retargeting, there is no mechanism to recover high-intent visitors through follow-up campaigns. This also eliminates the feedback loop required for performance optimization, forcing marketing decisions to rely on assumptions rather than behavioral data. Collectively, this reduces the efficiency of all acquisition spend and creates continuous leakage across the funnel.
Revenue Implication
While indirect, this missing infrastructure significantly limits lifetime revenue capture by preventing re-engagement of interested users. Industry benchmarks show retargeting contributes a meaningful share of ecommerce conversions, which is entirely lost in the current setup.
Recommended Fix
Implement a full Revenue Recovery Infrastructure Layer: install GA4, deploy Meta Pixel, configure key event tracking (product views, add-to-cart, checkout initiation), build segmented retargeting audiences, and establish a centralized performance dashboard for ongoing optimization and revenue monitoring.
The Strategy
Revenue Growth Plan
The recommended approach follows a structured three-phase Revenue Growth System designed to systematically remove conversion friction, establish measurement clarity, and activate revenue recovery mechanisms. Rather than treating issues in isolation, the strategy is designed to compound improvements across the full customer journey, ensuring that gains in one stage reinforce performance in the next.
Phase 1: Revenue Leak Elimination
This phase focuses on addressing the highest-impact conversion barriers within the homepage experience. The objective is to improve clarity, visibility, and decision flow by resolving core UX and messaging issues that currently suppress user progression. Key actions include CTA redesign, headline optimization, and simplification of the above-the-fold experience so visitors can immediately understand value and next steps without cognitive friction.
Phase 2: Tracking Infrastructure
Once conversion barriers are resolved, the second phase establishes a reliable data foundation for performance visibility. This includes implementing analytics and attribution systems that capture user behavior across the entire funnel. The goal is to move from assumption-based decisions to data-driven optimization by clearly identifying where users drop off and how they interact with key conversion points.
Phase 3: Revenue Recovery Engine
The final phase activates revenue recovery through structured retargeting and follow-up campaigns. Using behavioral data collected in Phase 2, the system enables re-engagement of visitors who did not convert on their first visit, converting previously lost traffic into recoverable revenue through ongoing marketing touchpoints.
Prioritization Framework
Execution is structured based on impact versus effort to ensure fast wins are delivered first while building toward long-term scalability. High-priority initiatives include CTA redesign, headline optimization, and analytics setup due to their immediate and disproportionate impact on conversion performance. Medium-priority initiatives include retargeting campaigns, which require additional setup but deliver compounding returns once tracking is in place. This sequencing ensures early conversion gains while progressively building a complete revenue system.
Technology Stack
The Revenue Growth System is supported by a streamlined performance stack designed for clarity, measurement, and scalability.
- Analytics Layer: Google Analytics 4 for full-funnel behavioral tracking and performance visibility
- Advertising Layer: Meta Ads for structured retargeting and conversion-driven campaigns
- Tracking Layer: Meta Pixel for capturing user behavior and building retargeting audiences
- Conversion Events: Product views, add-to-cart, and checkout initiation for funnel tracking
- Reporting Layer: Revenue Recovery Dashboard for continuous performance monitoring
Together, this stack forms the operational backbone of a scalable Revenue Growth System that enables both immediate optimization and long-term revenue recovery.
Implementation Roadmap
The implementation follows a structured four-week execution plan designed to rapidly remove conversion friction, establish measurement systems, and activate revenue recovery mechanisms in a sequenced and dependency-driven flow.
Week 1: Homepage Optimization
This phase focuses on immediate conversion fixes. The homepage is redesigned to improve clarity and visual hierarchy, with a high-contrast CTA replacing the existing version. The headline is rewritten to reflect customer outcomes rather than product description, and CTA copy is simplified to reduce ambiguity and increase purchase intent.
Week 2: Measurement Setup
This week establishes the tracking foundation required for performance visibility. Google Analytics 4 is installed and configured for full-funnel tracking. Meta Pixel is deployed to enable retargeting capabilities, and key event tracking is set up for product views, add-to-cart actions, and checkout initiation.
Week 3: Conversion Optimization
With tracking in place, this phase focuses on testing and behavioral refinement. CTA variations are A/B tested to identify highest-performing versions. Scroll depth tracking is implemented to measure engagement, and user interaction data is monitored to identify friction points and drop-off behavior.
Week 4: Revenue Recovery
The final phase activates re-engagement systems. Retargeting audiences are built based on user behavior and intent signals. Abandoned visitor and product-focused campaigns are launched, and a revenue reporting dashboard is implemented to track recovered conversions and campaign performance.
This phased rollout ensures that conversion improvements are implemented first, followed by measurement and finally revenue recovery, creating a complete end-to-end Revenue Growth System.
Projected Results
Revenue Impact
Based on the combined effect of resolving homepage conversion barriers, improving messaging clarity, and implementing a structured revenue recovery infrastructure, the total estimated upside represents a $6.75 million annual revenue opportunity at Duray’s current ecommerce scale.
This projection is not driven by a single optimization, but by a compounded uplift across the full Revenue Growth System — spanning attention, engagement, conversion, and recovery stages. Each improvement reinforces the next, resulting in exponential rather than isolated gains.
Before vs After Performance Outlook
Before Implementation: The current ecommerce experience is constrained by multiple structural inefficiencies that limit conversion performance:
- Bounce rate of 52.11%, indicating significant early-stage drop-off
- Low-visibility primary CTA reducing action clarity and engagement
- No retargeting infrastructure, preventing recovery of lost visitors
- Product-focused messaging that lacks clear customer outcome framing
In this state, a large proportion of traffic exits without entering the product discovery or purchase journey, leading to consistent under-monetization of existing demand.
After Implementation: Following execution of the Revenue Growth System, the experience transitions into a high-efficiency conversion environment:
- Improved engagement driven by clearer value communication
- Higher CTA interaction rates due to improved visibility and hierarchy
- Stronger message-to-market alignment through outcome-based positioning
- Active revenue recovery system enabling retargeting and reactivation of lost users
This creates a dual-path revenue system where both first-visit conversions and post-visit recovery contribute to overall growth.
Conversion Impact
The projected performance uplift is based on benchmarked CRO outcomes from comparable ecommerce optimization systems:
- CTA Engagement: +22% improvement driven by visibility and hierarchy enhancements
- Message Effectiveness: +15% improvement from outcome-driven positioning
- Visitor Retention: +8% improvement from reduced cognitive friction and clearer navigation cues
- Total Conversion Lift: Approximately +45% across the full funnel
Together, these improvements reposition the website from a passive digital storefront into a structured Revenue Growth System capable of capturing, converting, and recovering significantly more value from existing traffic.
Lessons Learned
1. Small Friction Creates Large Revenue Losses
Minor interface or messaging friction can create significant revenue leakage at scale. In ecommerce environments, even subtle reductions in clarity or decision ease compound into meaningful financial impact over time. Conversion performance is ultimately driven by micro-interactions, not just large structural changes.
2. Visibility Beats Creativity
A visually refined interface has no commercial value if users cannot clearly identify the next action. In this case, low-contrast conversion elements introduced unnecessary friction. Clear hierarchy and contrast consistently outperform aesthetic minimalism when revenue is the priority.
3. Outcomes Outperform Features
Customers rarely purchase based on specifications alone. Instead, decisions are driven by outcomes such as comfort, warmth, and durability. Messaging that translates features into tangible benefits significantly improves engagement and conversion performance.
4. Tracking Is a Survival Layer
Without analytics and attribution systems, user behavior becomes invisible after the first visit. This eliminates optimization capability and prevents retargeting, making revenue recovery impossible and limiting long-term growth potential.
Key Takeaways & Next Steps
This audit reinforces that ecommerce revenue performance is primarily determined by clarity, structure, and system design rather than traffic volume alone. First, small friction points in messaging and UI accumulate into significant conversion losses at scale. Second, visibility and hierarchy consistently outperform design complexity when driving action. Third, customers respond more strongly to outcome-based messaging than product descriptions. Finally, without tracking and retargeting infrastructure, a large portion of traffic becomes permanently unmonetized.
Immediate Actions
- Replace the ghost CTA with a high-contrast, visually dominant action button
- Rewrite homepage messaging to focus on customer outcomes rather than product features
- Install GA4 and Meta Pixel with full conversion event tracking
- Launch initial retargeting campaigns for abandoned visitors
- Implement a Revenue Growth Dashboard for ongoing performance monitoring
Collectively, these steps transition Duray’s homepage from a passive digital presence into an active revenue system designed to capture, convert, and recover value across the entire customer journey, unlocking significantly higher returns from existing traffic.
More in marketing

Venture
Write for entrepreneurs, founders, and builders.
Share startup lessons, growth tactics, and founder stories with readers on the same journey.
One free account across In Plain English, Stackademic, Venture, and Cubed.
How it works- Startups & entrepreneurship
- Marketing & growth
- Productivity & leadership
- Founder stories & lessons learned
Sign in
Google or GitHub
Complete profile
Takes a few minutes
Get approved & publish
Start sharing
Why write for Venture?
Entrepreneurship is rarely a straight path. The lessons worth sharing are learned while building.


Comments
Loading comments…